 |
Additional Examples From Our Blog
| Find patterns of interest We're examining the US nonfarm payroll seasonal adjustments below for the first eight months of 2010 against the prior year and the five-year mean, with our results shown graphically below. View post  | |
| Link datasets seamlessly for integrated analysis We've linked a foreign exchange dataset with an energy dataset and, in the chart below, plotted US natural gas prices in both US and Canadian dollars. View post | Related Items:
|
| Monitor your data and get alerted to unusual events or trend changes Here, we've highlighted an instance where there was a significant spike in natural gas in storage, as measured by standard deviation. View post 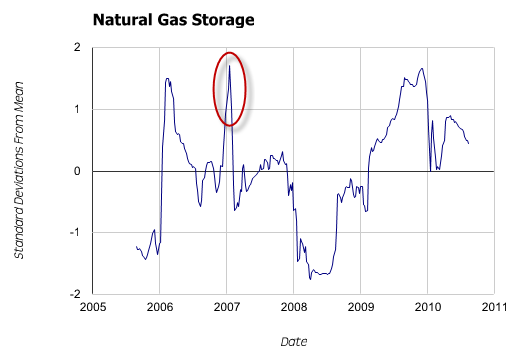 | Related Items:
|
| Bring your analysis to life with over a dozen chart types We're sizing the total dollar impact of all the US bank failures since the FDIC was formed in three different ways, aggregated by state. View post | |
| Extract, validate and import data in real-world conditions Data isn't always clean, and extractors help to address this problem. We'll remove the extraneous text from around the company ticker before importing it. View post   AAPL |
Sign up for a free account now and get started today